/Primary%20school%20.jpg?width=2000&name=Primary%20school%20.jpg)


.png?width=940&height=788&name=Lingfield%20College%20Case%20Study%20(5).png)
-1.png?width=1000&height=833&name=National%20Association%20of%20Head%20Teachers%20(3)-1.png)
-3.png?width=1080&height=1080&name=Untitled%20design%20(10)-3.png)


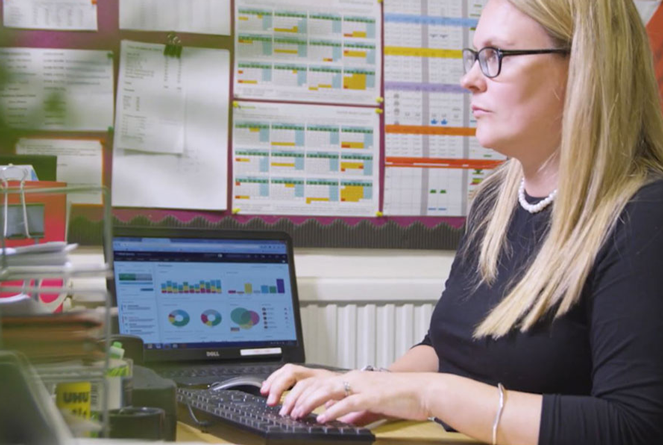
Results day is one of the most data-rich moments in the school calendar. By now, many of you will have spent hours in Sisra Analytics, dissecting your GCSE and A-level results: comparing to national figures, identifying subject strengths, and pinpointing group gaps.
That’s essential work, but here’s the challenge: What happens next?
Too often, results analysis becomes a retrospective exercise. The insights are sharp, but by the time they’re applied, we’re halfway through the next academic year. We know that fast tracking pupil insight into teaching and intervention will really move things forward, but for most schools, the challenge remains the same... how can you do this effectively & efficiently?
Accuracy: connecting grade predictions to raw data
Sisra Analytics is an invaluable tool for senior leaders, providing powerful analysis of grades submitted by teachers to model whole-school performance and identify key gaps.
But these grades can come from different types of assessments, entered on separate spreadsheets, and sometimes only updated two or three times a year. Without the underlying raw mark data, it’s harder to know exactly what is driving the gaps, or to have an action-led conversation with teachers about how to close them.
This is where Pupil Progress adds value: it captures raw marks throughout the year, calculates grades exactly as the exam board would, and pinpoints the precise topics, skills, or units where students are underperforming. When both systems are used together, your predictions stay grounded in accurate, curriculum-linked evidence.
💡 Tip: Don't forget to check in with your grade boundaries to inform your mock grades and Teacher Predicted Grades this year.
📎 Related reading: Grade boundaries went up; an excuse? The truth? Or useful information? Our analysis of the 2025 GCSE & A-level grade boundaries and how to set realistic ones for 2025/26.
Includes free downloads:
Joining up your data
Sisra Analytics is an incredible tool for analysing teacher-entered grades to show whole-school performance, gaps, and predicted measures. This insight helps identify which subjects, groups, or students need attention.
The challenge is that these grades are often drawn from different types of assessments, updated infrequently, and not linked to the raw marks or question-level data that produced them. That means leaders can see where the problem is, but not the why or how to fix it.
Pupil Progress fills that gap. It tracks raw marks throughout the year, calculates grades exactly as the exam board would, and pinpoints the specific topics, skills, or units where students are underperforming.
By using both together:
- Sisra Analytics gives the whole-school and group-level performance picture.
- Pupil Progress provides the detailed, curriculum-linked evidence to take targeted action.
This enables senior leaders to move seamlessly from identifying a gap in Sisra Analytics to sitting down with a subject leader, filtering the exact students affected in Pupil Progress, and agreeing precise interventions that raise attainment.
From insight to implementation
You now have the opportunity to take what Sisra Analytics has revealed this August and use in tandem with Pupil Progress to guide live teaching and tracking into the autumn term.
- Complete your Sisra Analytics post-results deep dive. Set subject specific priorities for the year, based on results analysis and early predictions for new cohorts.
- Meet with department leads, share Sisra Analytics insights and agree the curriculum adjustments and focus areas for 2024/25.
- Jump into Pupil Progress to create intervention groups based on underperforming students in year 10 and 12, using the raw data to identify common weak skills or topics to address.
- Track progress together: enter assessment data into your exam-board specific Pupil Progress trackers, and use accurate grades calculated directly with Sisra Analytics to analyse whole-school performance measures and identify areas for improvement
- Review each half term - if predictions and evidence don’t align, adjust teaching plans early.
💡 Additional resource:
Download our Pupil Progress & Sisra Analytics Term-by-Term Actions Timeplan to see how both systems can be used in tandem across the whole school year.
The result? Grade predictions you can trust, with the raw data informing targeted interventions that hit the right skills to raise attainment and close gaps.
Transform your 2025/26 outcomes
By using the insights from whole-school or trust-level analytics in Sisra Analytics, alongside the detailed, live raw data from your subject-specific trackers in Pupil Progress, you create one source of truth for data, backed by powerful analytics.
This combination empowers senior leaders to have deep, meaningful, and action-focused conversations with subject leaders and teachers. You can connect your whole-school action plan with targeted, focused intervention at a classroom level, driven by teachers through curriculum time and supported by precise additional intervention.
It builds a data-driven, action-focused culture in your school or trust, ensuring you focus your precious time where it will have the greatest impact. Ultimately, this is about working together to support students to achieve the very best they can.