/Primary%20school%20.jpg?width=2000&name=Primary%20school%20.jpg)


.png?width=940&height=788&name=Lingfield%20College%20Case%20Study%20(5).png)
-1.png?width=1000&height=833&name=National%20Association%20of%20Head%20Teachers%20(3)-1.png)
-3.png?width=1080&height=1080&name=Untitled%20design%20(10)-3.png)


Introduction
Ensuring educational equity is a top priority for schools across the UK. Disadvantaged students often face unique challenges that can impact their academic performance. To support these students, it's crucial to understand who they are and how their needs differ from other students.
The attainment gap between disadvantaged students and their peers is well-documented and begins as early as Key Stage 2. By the time students reach Key Stage 4, this gap often widens, with disadvantaged students showing lower overall attainment and progress. Schools are working hard to address this issue, and tools like Sisra Analytics can play an important role in identifying and closing the gap.
Sam Huxley, one of Juniper's Data Consultants, has written this guide to help schools understand the definition of disadvantaged students, the differences between Pupil Premium and Disadvantaged students, and how Sisra Analytics can assist your school in monitoring and improving these students' performance.
The definition of disadvantaged students
The Department for Education (DfE) defines 'Disadvantaged' students as those who are:
- Eligible for Free School Meals (FSM) in the previous six years
- Looked after children for more than six months during the year
- From 2015, the definition also includes children who were looked after for at least one day during the year or who have ceased to be looked after by a local authority in England and Wales due to adoption, a special guardianship order, a child arrangements order, or a residence order.
Disadvantaged students vs. Pupil Premium students
Schools often equate their Pupil Premium students with their Disadvantaged students, though there is a key difference: Pupil Premium includes service children, whereas Disadvantaged does not.
The disadvantaged gap at KS4
The attainment gap for disadvantaged students at Key Stage 4 (KS4) is well documented. This gap develops when students sit their KS2 SATs in Year 6. By the time they reach KS4, disadvantaged students, on average, have lower overall attainment and make less progress from KS2. Schools are actively working to address this gap.
How Sisra Analytics can help
Sisra Analytics is a data analysis solution designed to help schools identify and address the attainment gap for disadvantaged students.
Key features of Sisra Analytics:
- Flexible data upload: Schools can upload key information and assign filters to their student population, allowing for targeted reports.
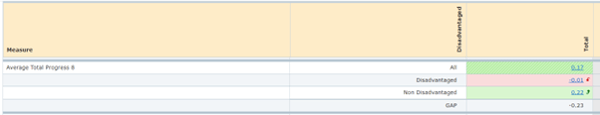
- Comparison within filter groups: Schools can compare headline figures and grade breakdowns for disadvantaged students with those for non-disadvantaged students.
- Performance tracking: Using the tracker functionality, schools can monitor student performance against expectations each term and quickly identify students who may be falling behind.
- Impact measurement: Schools can measure the impact of interventions on the attainment and progress gap.
- National comparison: Schools can compare their performance to other schools nationally by opting into Sisra Data Collaboration.
Using trackers to monitor progress
Schools using the tracker functionality can see how their students are performing each term and identify any students who may be falling behind. This feature also helps measure the impact of interventions aimed at addressing the attainment and progress gap. For more information on setting up trackers, you can watch our short YouTube video.
Comparing with national data
Schools participating in Sisra Data Collaboration can compare their figures with those of other Sisra schools nationally. This comparison includes overall performance and breakdowns for SEN, gender, and disadvantaged students. It allows schools to see how their gaps compare to the national average.
Setting appropriate targets
The Subject Progress Index (SPI) feature helps schools set appropriate targets for disadvantaged students. SPI provides an estimate for individual students per subject based on the performance of students with the same KS2 starting point. This helps eliminate unconscious bias and ensures targets are based purely on performance
The figure above shows that the first student in the list has a more challenging target: 1.67 grades above the average achieved by students with the same KS2 starting point. The bottom student in the list, however, has a target almost one whole grade below the average achieved by students with the same KS2 starting point.
Using filter tags
Schools can add filter tags to student groups, allowing for focused analysis. These tags help quickly identify key groups of students in reports, facilitating targeted interventions.
Conclusion
Addressing the attainment gap for disadvantaged students is crucial for schools. Sisra Analytics provides powerful tools to help schools identify, monitor, and address this gap, ensuring all students have the opportunity to succeed.
Take action to bridge the attainment gap
Don't let the attainment gap hold your students back. Equip your school with the tools and insights needed to support all learners.
If you’d like to learn more about Sisra Analytics, contact us now to book a free demonstration.