/Primary%20school%20.jpg?width=2000&name=Primary%20school%20.jpg)


.png?width=940&height=788&name=Lingfield%20College%20Case%20Study%20(5).png)
-1.png?width=1000&height=833&name=National%20Association%20of%20Head%20Teachers%20(3)-1.png)
-3.png?width=1080&height=1080&name=Untitled%20design%20(10)-3.png)


A report published by the Guardian last academic year has suggested that a third of 15-year-olds have been persistently absent from the classroom (FFT Datalab), and research shows that absence rates remain higher than before the coronavirus pandemic.
The reported high rates of absence in years 10 and 11 are a particular concern due to the knock on effect on GCSE results, with previous research published by the Department for Education (DfE) showing the correlation between high rates of absence and lower grades than students who attend school more regularly.
According to the FFT, the research data also shows that students from disadvantaged backgrounds were particularly prone to absence.
Get the data you need!
We know how important it is for schools to track students’ attainment and closely monitor the impact attendance levels can have on this.
With Sisra Analytics, not only can you analyse attainment and exam data in KS3, KS4 and KS5, but it also allows users to triangulate pastoral data such as attendance, behaviour, and data surrounding attitude to learning too.
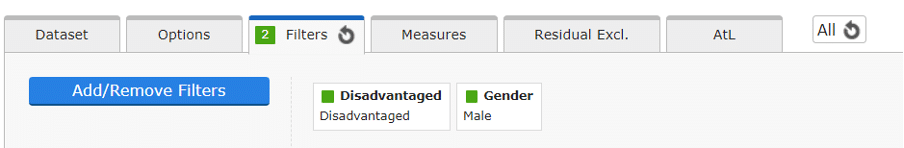
Schools have the ability to include up to 20 student filter options to allow staff to deeply analyse the impact student characteristics can have on attainment and ensure key groups of students are easily identifiable.
Incorporating attendance banding as a student filter, allows schools to monitor the effects of attendance on various aspects of school data such as headlines, qualification, class, and student level, as well as identify those lower attendees for possible intervention. With interactive buttons throughout the reports, schools can drill down deeper to see which students are accountable to each band at both subject, class and student level.
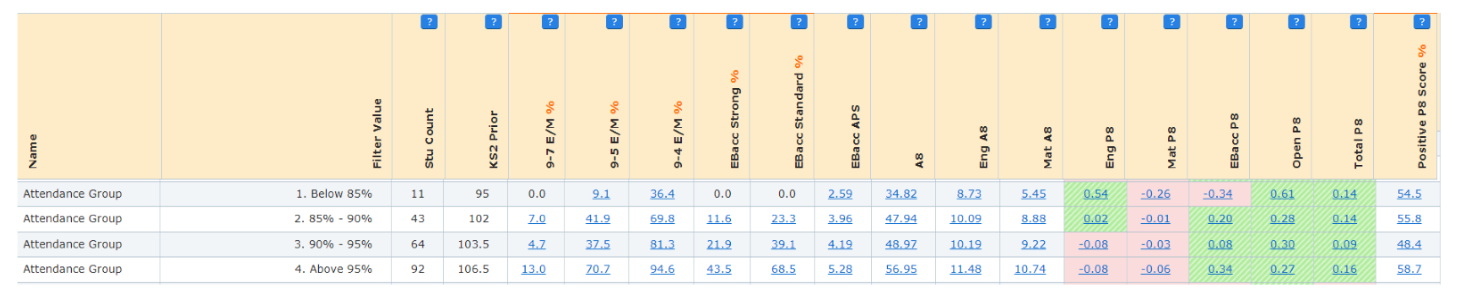
Proven results
We have shown an example report below when the characteristic of ‘disadvantaged’ is added into Sisra Analytics and allows users to see the two compared, as well as monitor the gap analysis.
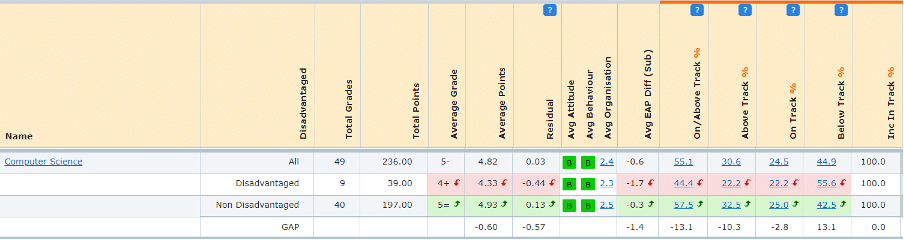
When analysing reports within Sisra Analytics, schools are able to not only view the various values of student filters on screen to show how the outcomes can vary, but also filter to key groups of students who they may be interested in analysing further such as disadvantaged males, with the tables of data changing to reflect these choices.
Once schools have incorporated their chosen school filters into Sisra Analytics, administrators are able to easily apply custom ‘Tags’ to appear next to students to identify key groups to allow for quick detection when analysing reports. Our example below shows students with a higher prior attainment, lower attendance banding and disadvantaged as well as showing any students in possible focus or intervention groups.
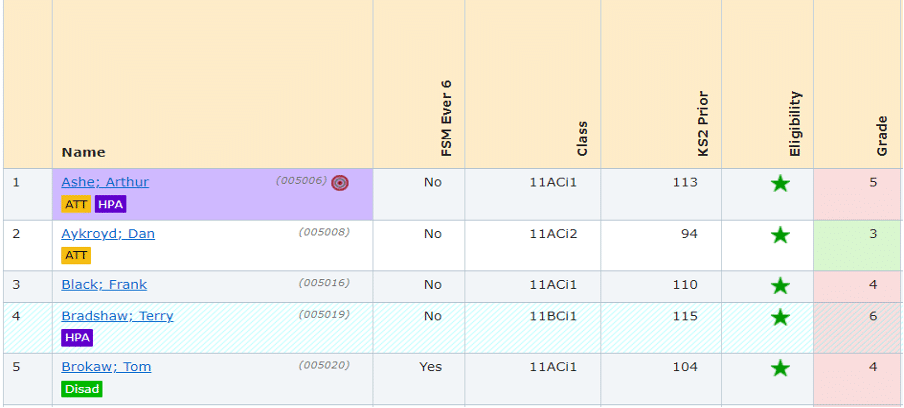
Bespoke Focus Groups can be created to track specific groups of students, allowing early intervention to minimise the risk of headline measures being affected in the summer and also to ‘tell a story’.
Discover how to create and use student focus groups in our short video.
Sisra Analytics allows schools to fully understand and monitor the impact that certain student characteristics and attendance patterns can have on attainment and outcomes, allowing for quick and easy analysis at a click of a button.
If you’re already using Sisra Analytics, there are a range of guides within the HELP area, available to support administrators with the setup of their student filters, as well as reporting advice, including step by step instructions and clear visuals to ensure users get the most out of their setups and can analyse quickly and efficiently.
You can also watch our latest video on attendance here.