/Primary%20school%20.jpg?width=2000&name=Primary%20school%20.jpg)


.png?width=940&height=788&name=Lingfield%20College%20Case%20Study%20(5).png)
-1.png?width=1000&height=833&name=National%20Association%20of%20Head%20Teachers%20(3)-1.png)
-3.png?width=1080&height=1080&name=Untitled%20design%20(10)-3.png)


The Subject Progress Index (SPI) has been introduced into Sisra Analytics Reports for schools involved in KS4 Data Collaborations (from 2018 onwards).
The SPI directly indicates how a pupil, class, subject or any group of pupils has performed compared with pupils in the same subject with the same KS2 prior. A true subject value added measure. Think Subject P8, but RELEVANT (and far more FAIR and ACCURATE than dividing A8 by ten or slicing up baskets!)
With over 1150 schools opted in (185,000 pupils) as of Window 3 – we are confident we have enough data across all subjects for our SPI to be accurate and quite revolutionary, finally giving schools an accurate subject VA-style measure. Pupil SPIs calculated using low cohort figures (e.g. below 25) will be marked with an icon.
A visual explanation of the calculation is available at the foot of this post.
How will this be shown in the Reports?
Reports have been updated to show any Data Collaboration related data in “BLUE” columns.
The following shows the updated Grade List Report. Here we can see not only how our pupils have performed in the recent exams (this happens to be the English Language), but we can also see how their progress from KS2 compares with all pupils on the same starting point across all opted in Sisra schools for this subject.
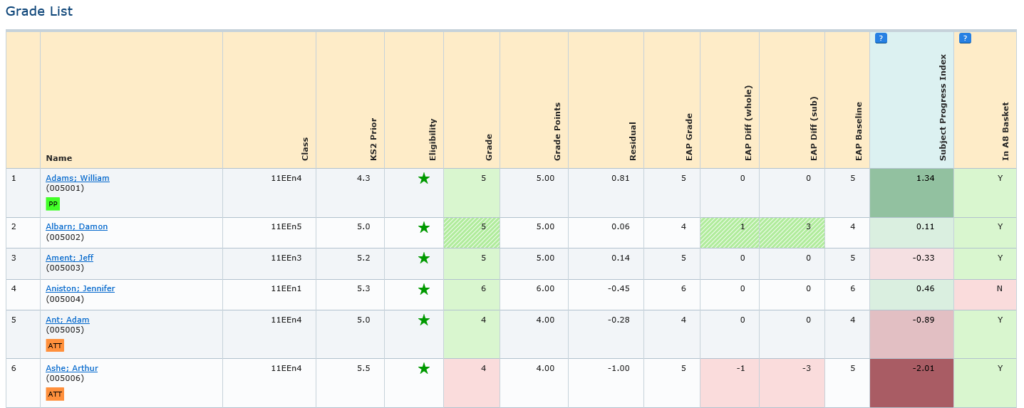
The above shows that William Adams (KS2 prior of 4.3) achieved a Grade 5 in his exams for the English Language. The SPI of 1.34 tells us that William achieved more than a grade higher in the English Language than the average English Language for pupils who also had a KS2 prior to 4.3. Notice the boldest colours denote positive/negative differences of more than one whole grade.
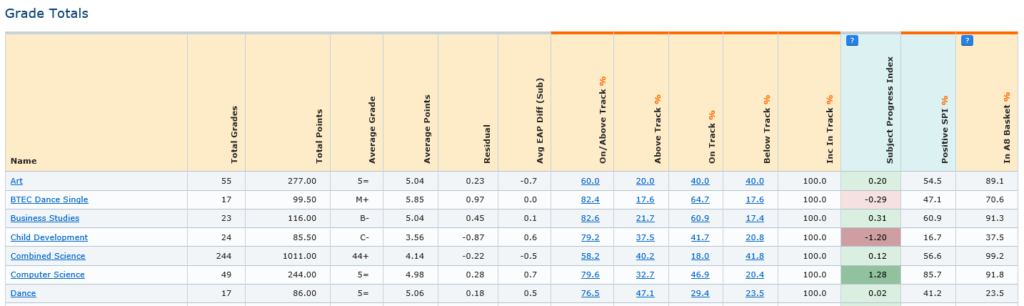
SPI can also be calculated at a higher level to indicate class, subject and perhaps even faculty performance compared with Sisra “National” picture. The Grades Totals report shows the average SPI for each Qualification, and if “percentage view” is enabled, then you’ll also see the percentage of pupils with a positive SPI.
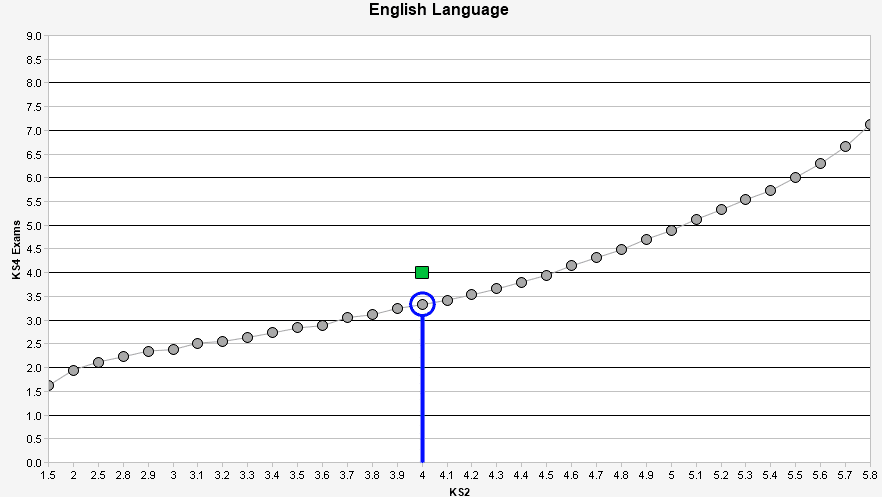
Calculation Example
Joe Bloggs came in on an (avg) KS2 prior of 4. He then achieved a Grade 4 in the English Language, shown by the green square below. The Average English Language exam points achieved by all KS2 level 4 pupils was 3.3 (identified in blue below).
Joe Bloggs’ SPI for the English Language is 4 – 3.3 = 0.7.
Joe achieved 0.7 of a grade higher than the average KS2 prior 4 pupil in English Language.
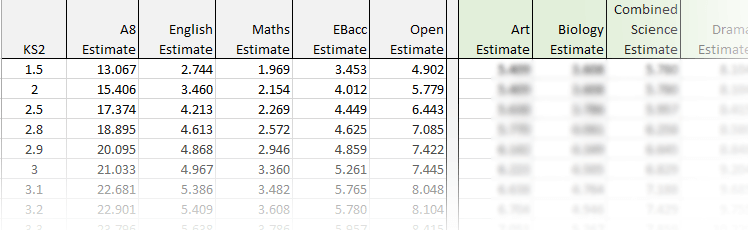
Another way of visualising how SPI is calculated is to simply imagine our Data Collaboration A8 estimates as below, but with columns added for each subject group. Art would have its own estimates, as would Biology etc.
The future?
We believe the SPI will become a vital tool for schools, not only to see how pupils have performed compared with their peers, but as we move further into the new academic year we expect you to be able to compare current cohort assessments and even targets against last year’s cohort, allowing you to ensure you are doing all you can to add value on a subject by subject, pupil by pupil basis.